Results Page
You can easily track the results of your experiments with Convertize Analytics. To see the results page of an experiment, go to a Project, find the experiment you want in the list and click ‘Results’.
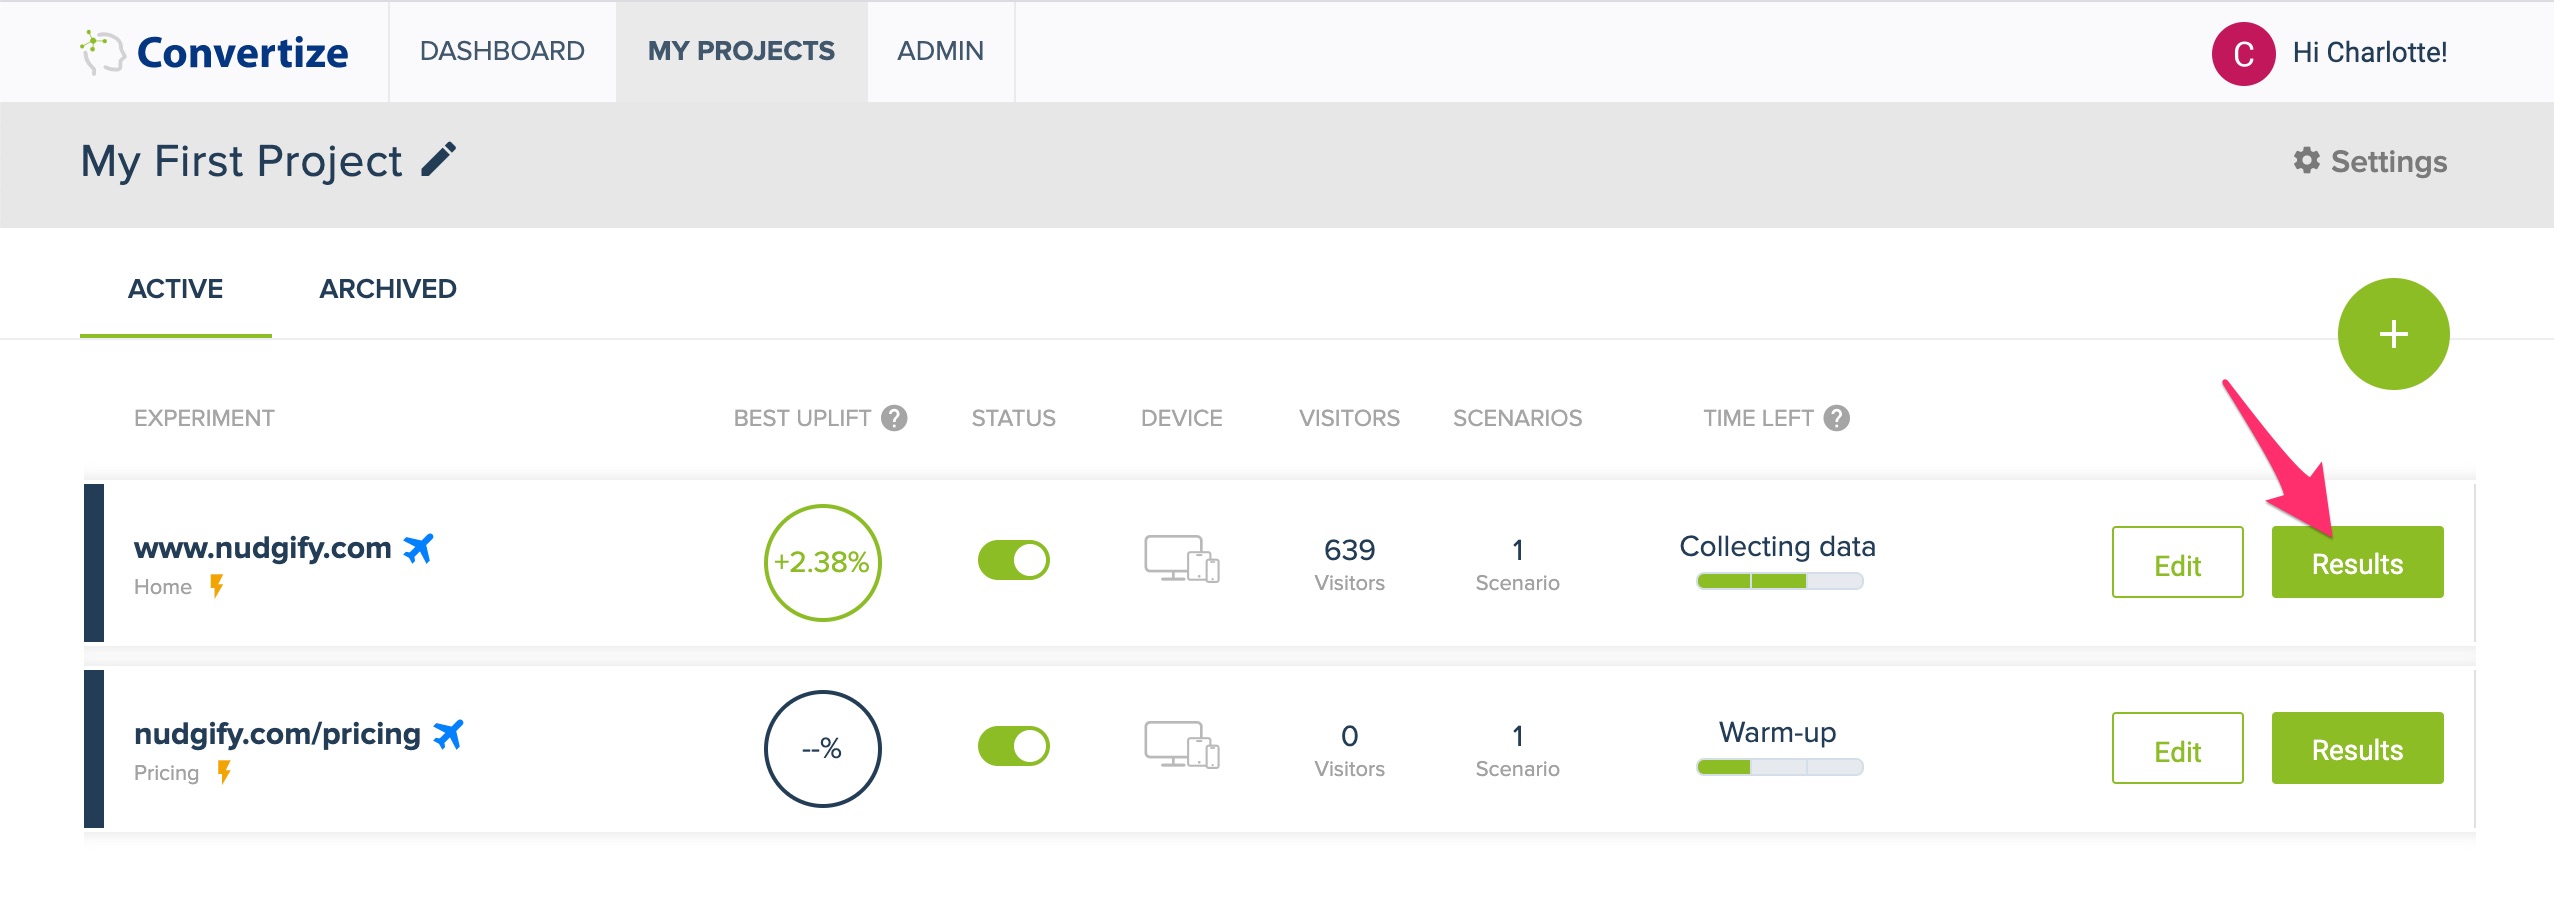
The results page tells you how much longer your experiment will take, and how your scenario(s) is performing compared to your original.
Which page variation is the best?
The charts and table allow you to see at glance how your scenario(s) are performing compared to the original (baseline).
The best performing version is the one with the highest Conversion Rate: the most conversions per visitors.
Conversion = goal
A conversion happens when a visitor of your page performs the action you want them to perform, such as making a purchase or clicking the “sign-up” button.
You decide what Convertize counts as a conversion by setting one or more goals for your experiment. For each goal you set, a graph and table with the results are visible on the results page.
One of your goals is your ‘primary goal’. The calculated significance of the experiment is based on this goal. By default, the first goal you create in the editor is your primary goal. You can change this in Settings.
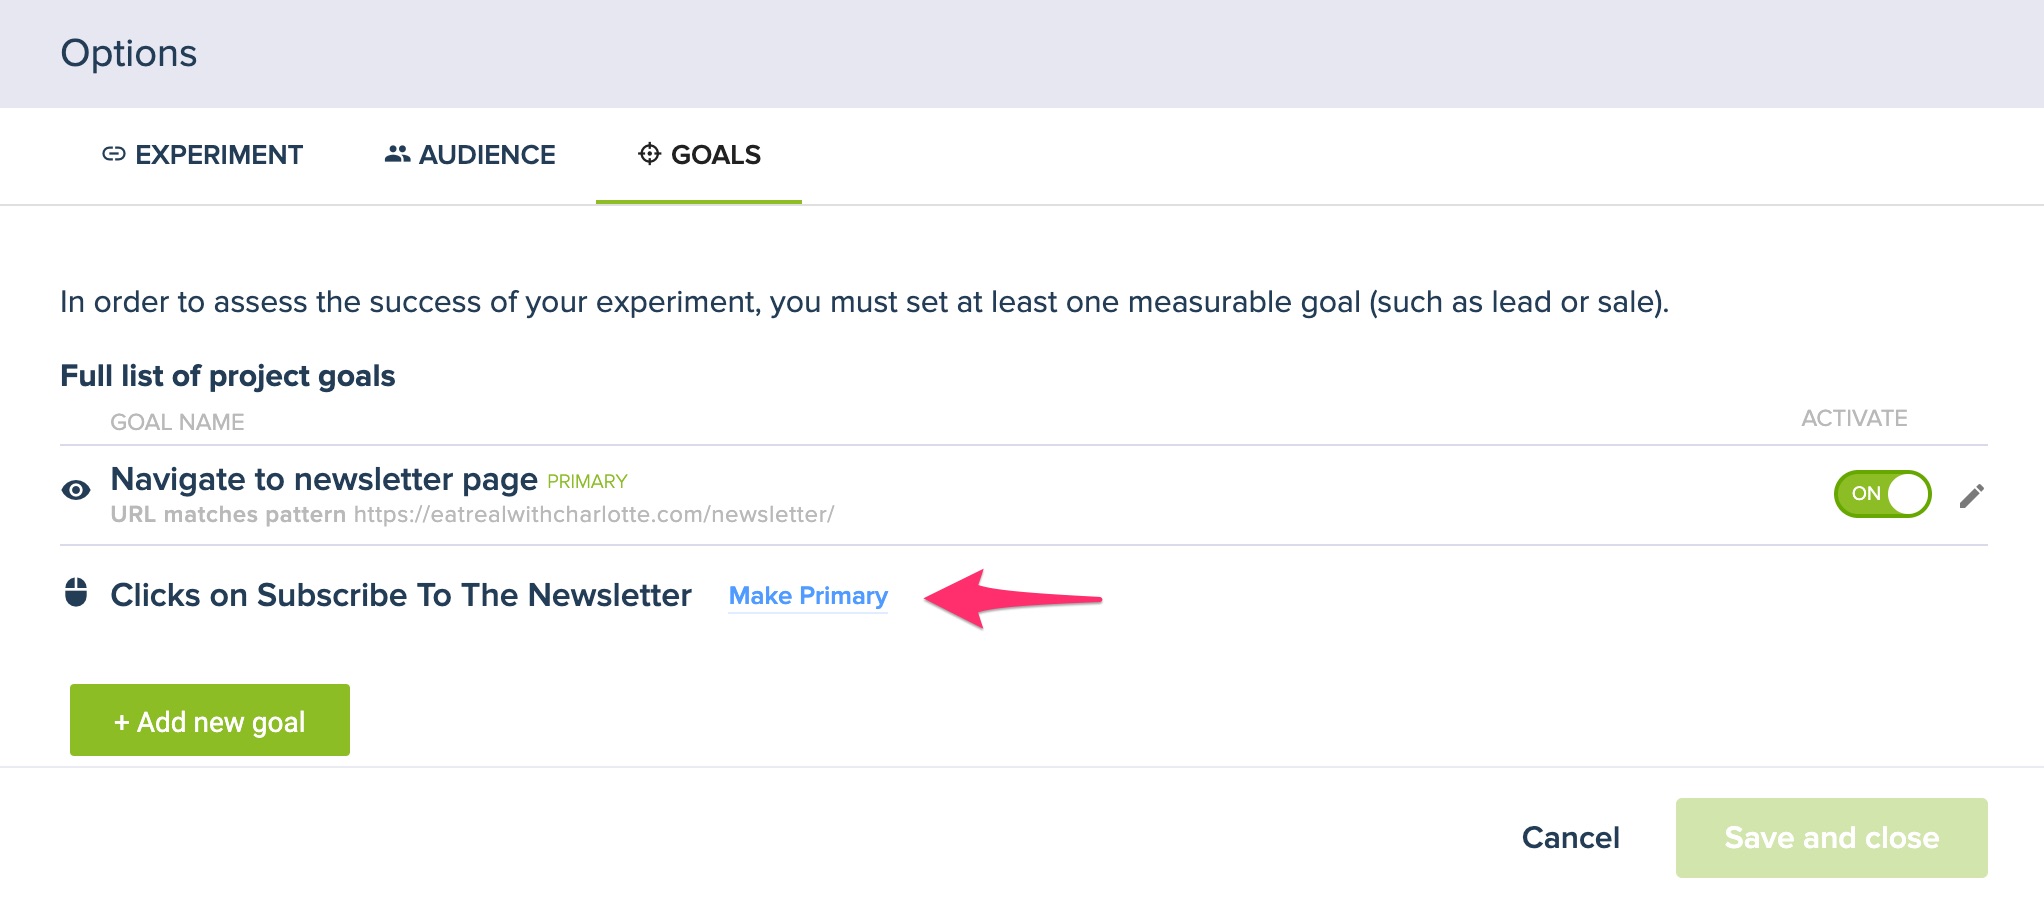
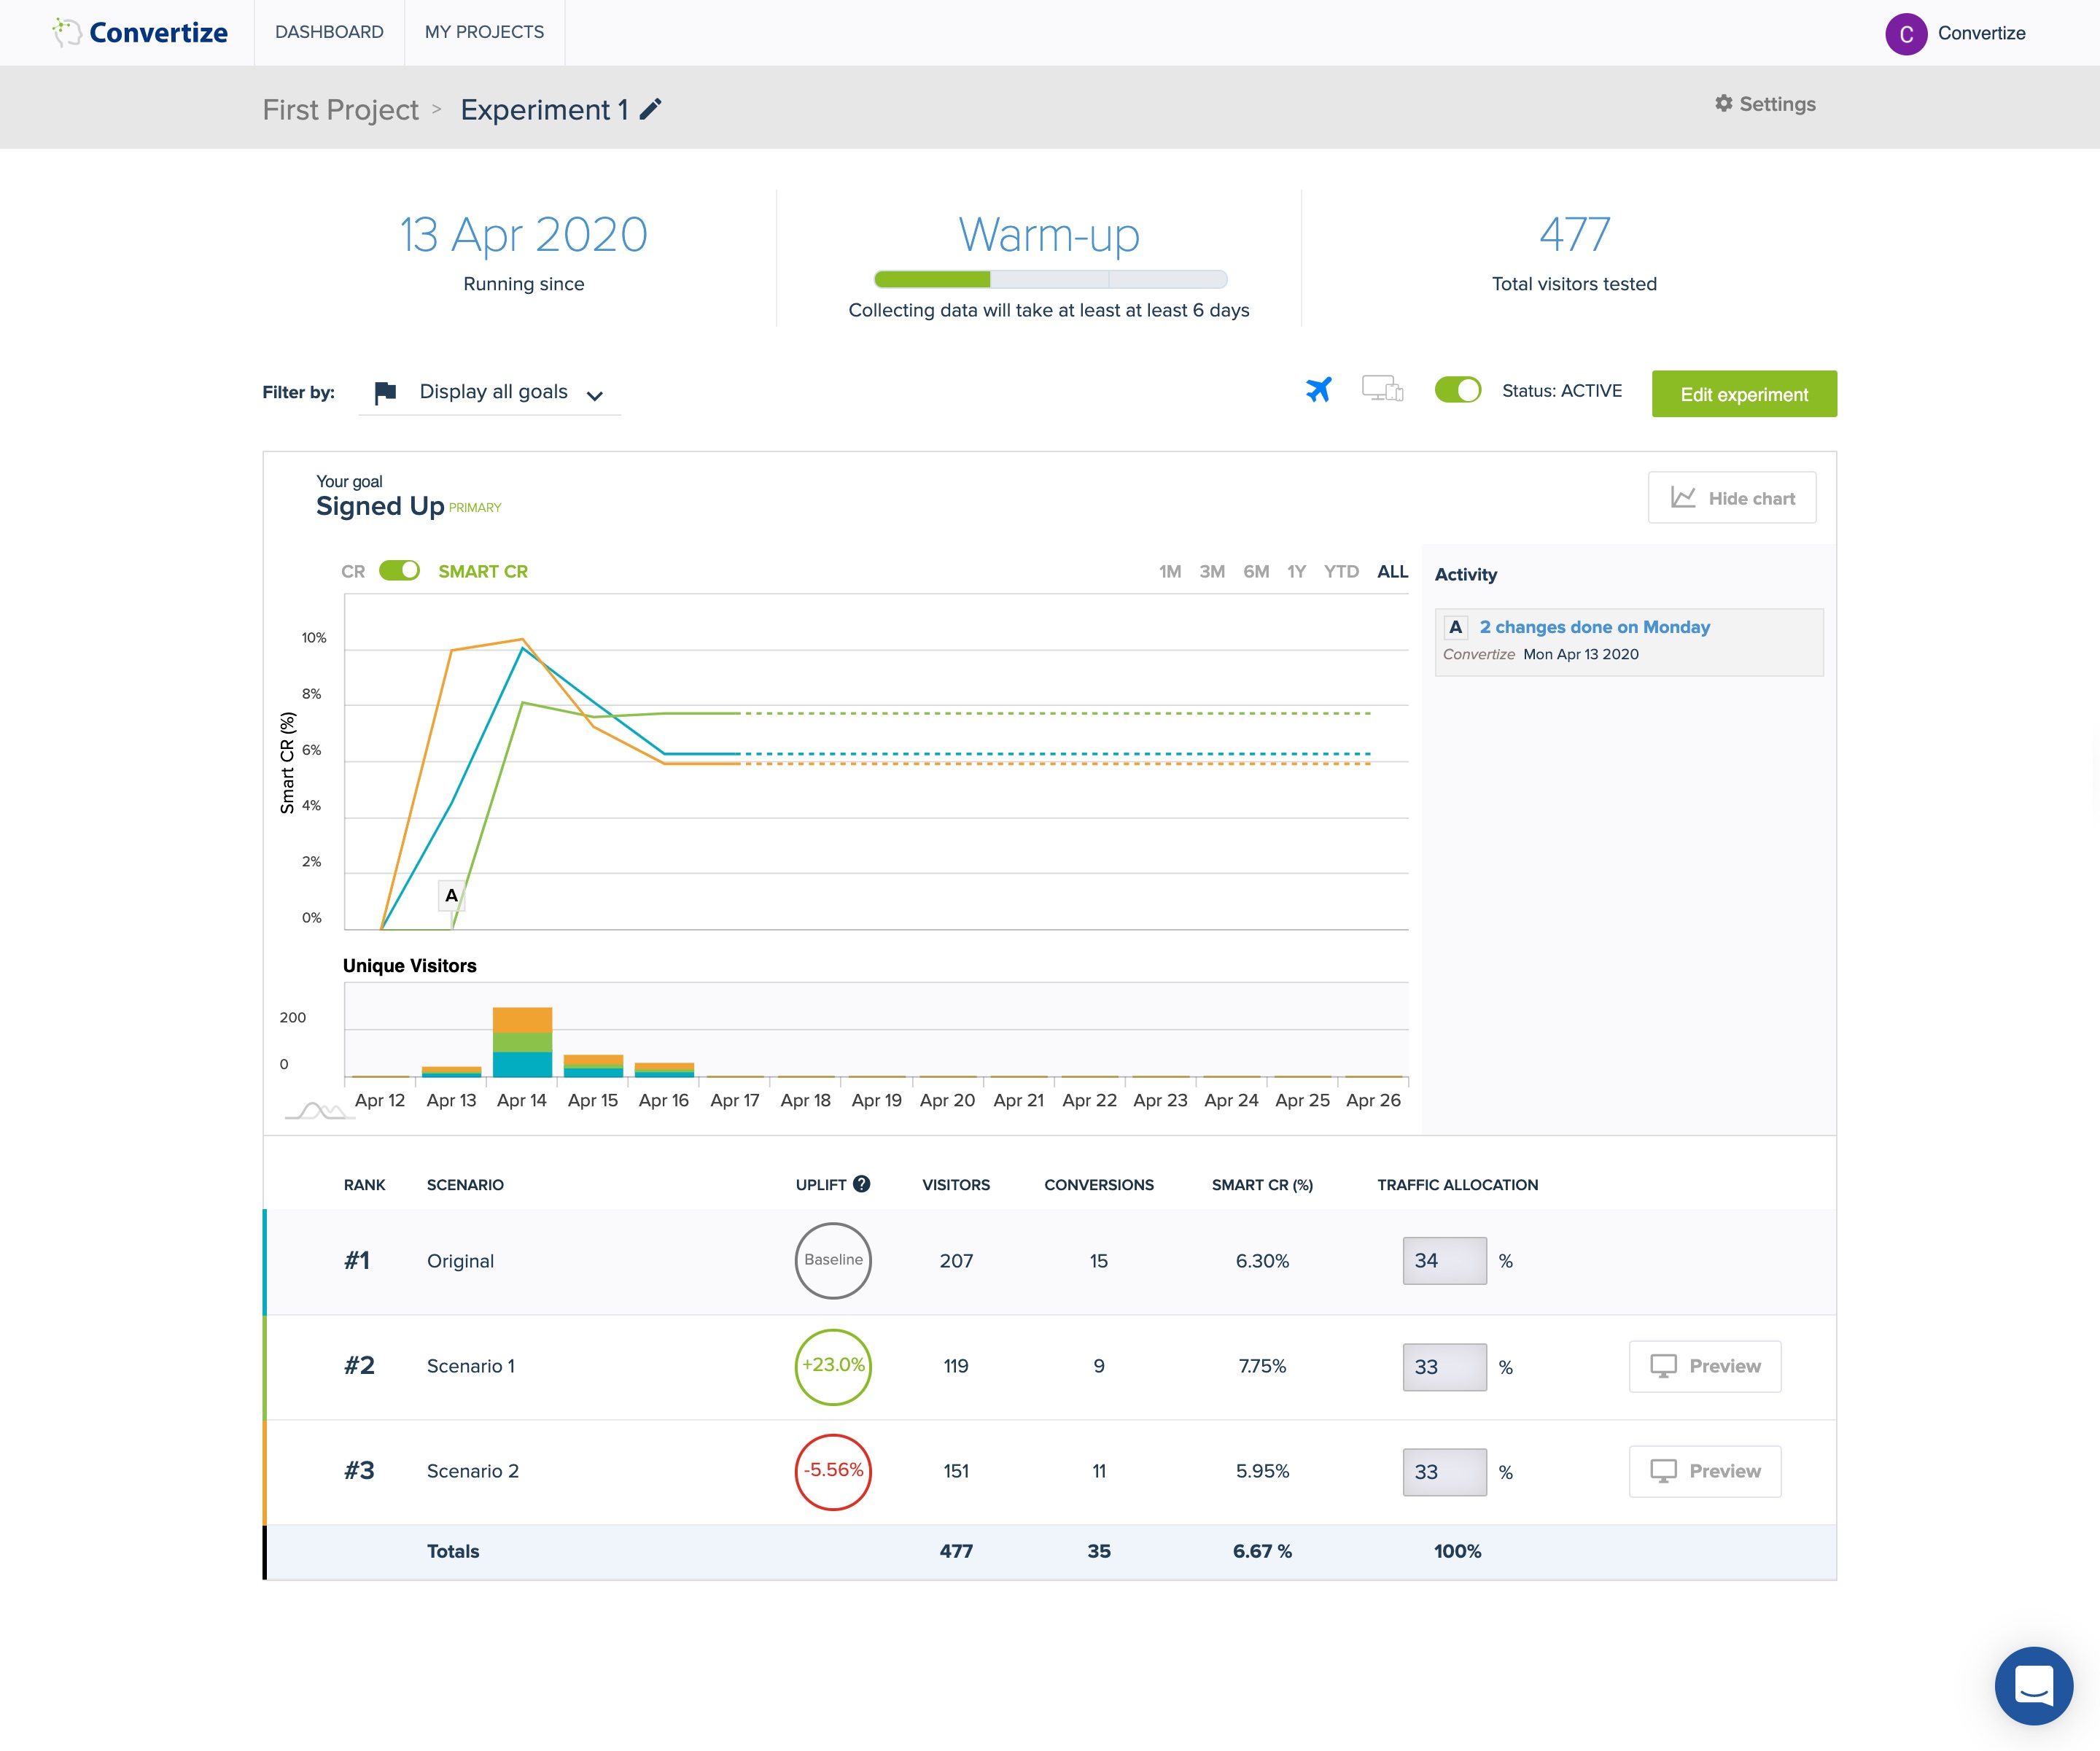
Chart: see at glance which variation is best
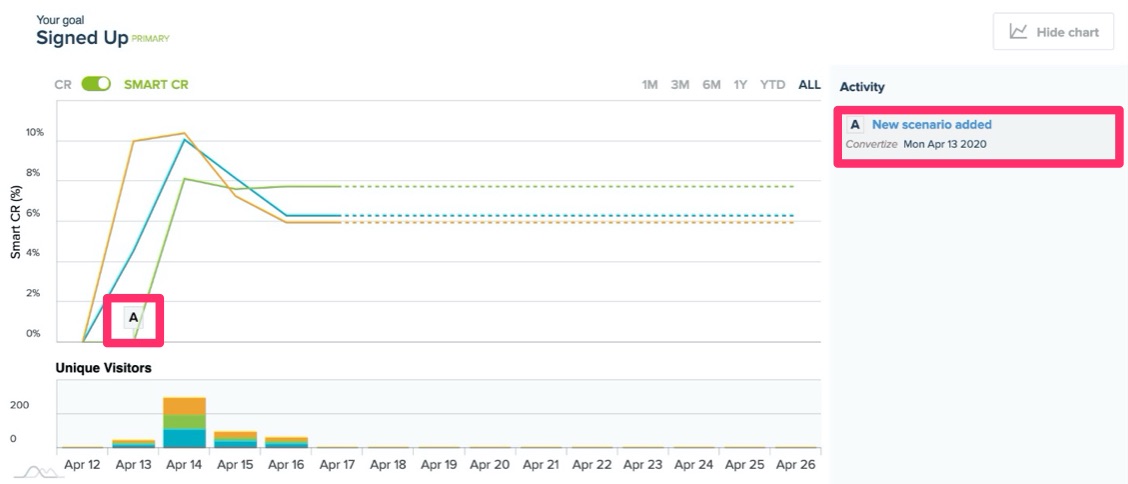
The chart gives you a visual projection of the results per goal. In the example, you can see the chart for the goal ‘Signed Up’.
The line chart, with a coloured line for each variation, shows you how the variations are performing. For future dates, the lines are dotted.
The bar chart shows you the number of visitors to each variant of your page per day.
By default, the chart shows all data for the running time of your experiment. If you wish to show for example the results of the last month or year only, you can change that on the top right.
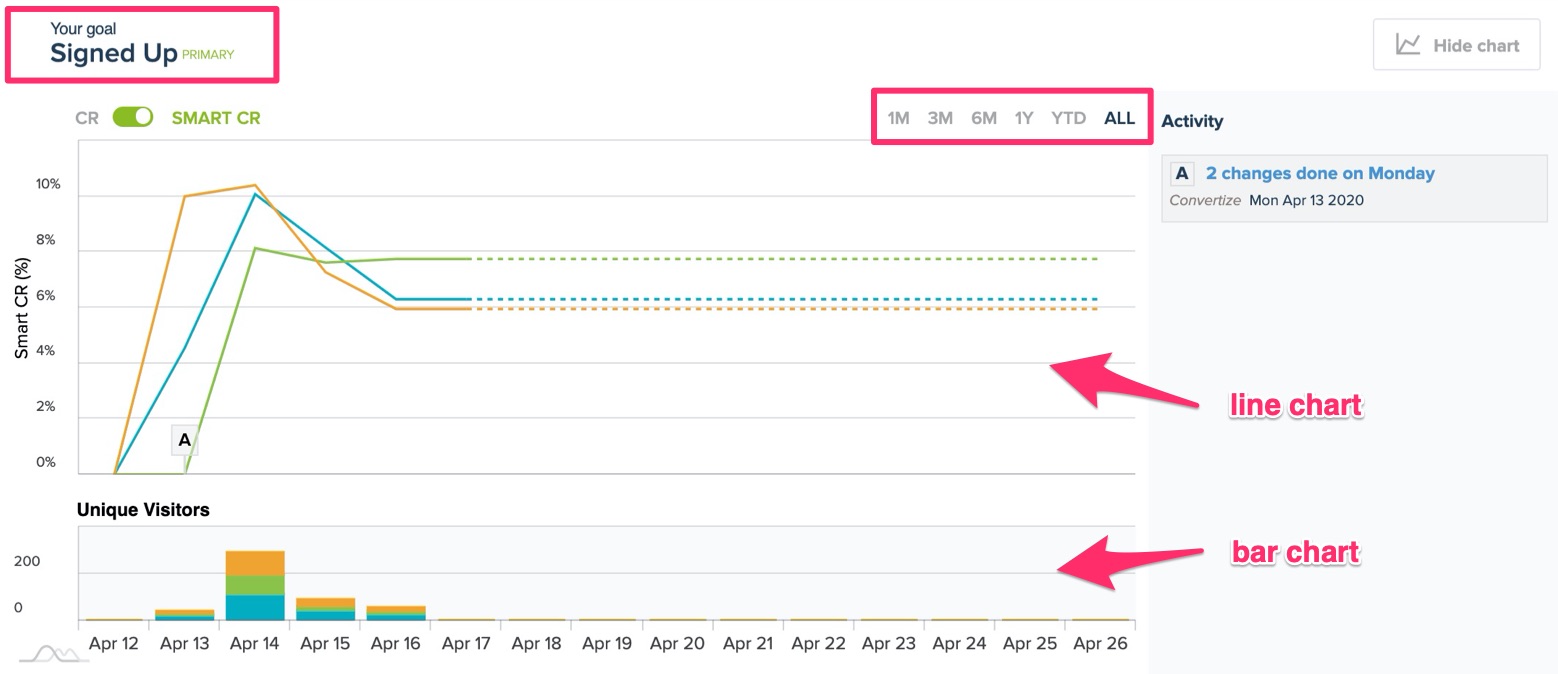
Table: get the numbers
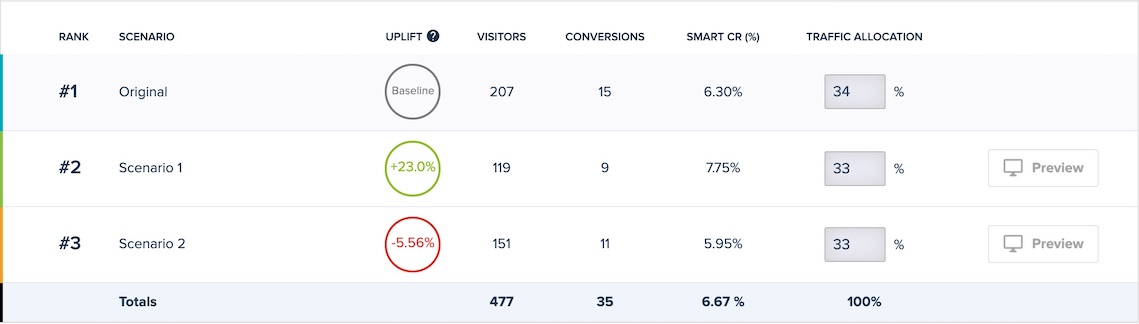
The table shows you per variation:
Uplift: how much better (green) or worse (red) a scenario is performing compared to the original (baseline)
Visitors: the number of unique visitors
Conversions: the number of conversions
(Smart) Conversion rate: conversions/unique visitors
Traffic allocation: the percentage of total traffic allocated to that variation
How long does my experiment take?
Convertize calculates and estimates how long your experiment will take to reach statistical significance. At the top of your results page, you can always see how much longer your experiment takes and what the current confidence level is. You are notified when significance has been reached. This way, you don’t have to worry about calculating statistical significance yourself.
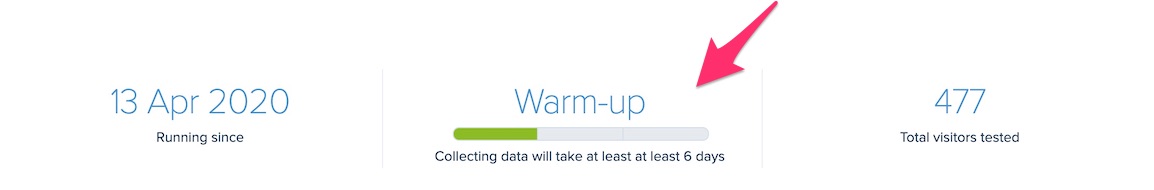
Warm up: When you just launch your experiment, it is in the warm up phase. This takes at least 7 days. During the warm up, the platform gathers data to calculate how long your experiment will need to run for. This depends on the number of visitors and conversions that you have. The more data you have per day, the faster your experiment will reach significance.
Collecting data: If not enough data has been gathered during the 7 day warm up, the platform will display ‘collecting data’. This means that although your experiment is past the 7 day warm up, more data is needed to estimate how much longer your experiment will need to run for to reach significance.
X days left: Convertize has collected enough data to make an estimate. You now know how much longer your experiment needs to obtain a reliable result.
Completed: Congratulations! Your experiment has reached a reliable result.
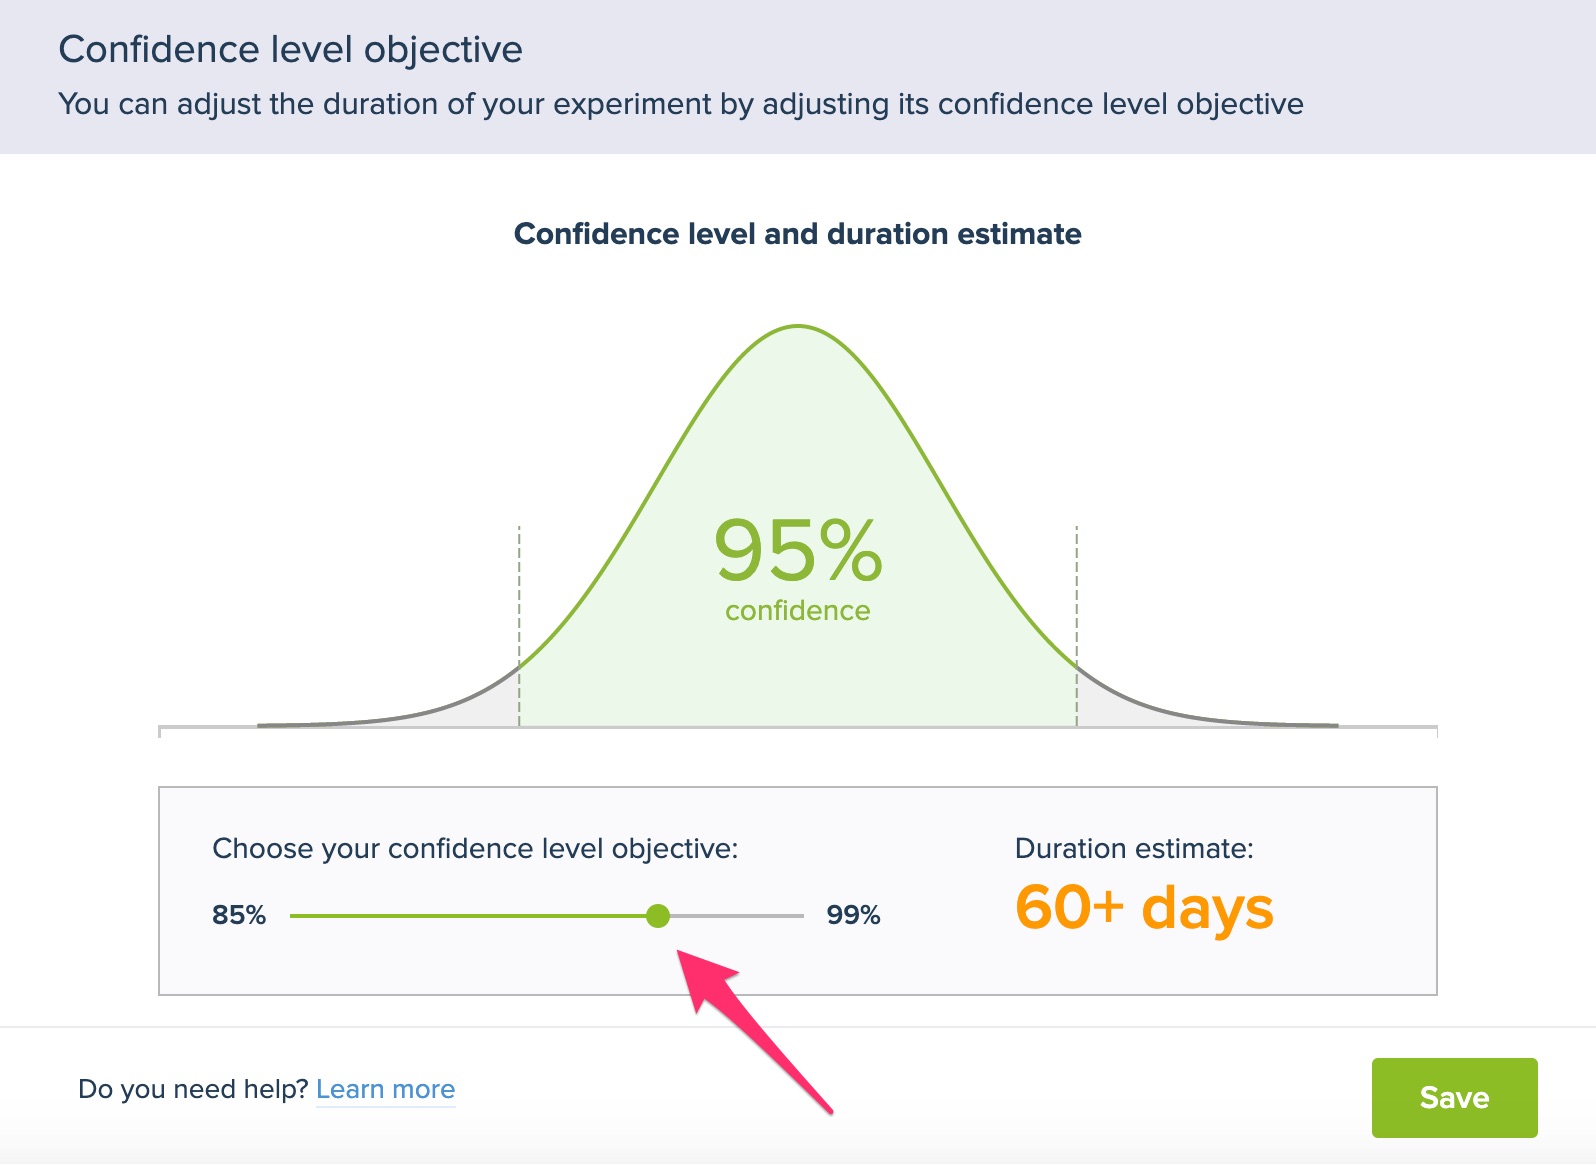
Confidence level objective
By default, Convertize aims for a significance level of 95%. When this level has been reached, your experiment is complete. If you want your test to be quicker, you can lower the significance level you aim for to as low as 85%. You can also aim for a higher significance level, if you want to be extra sure. The Duration Simulator calculates for you how much quicker or slower your experiment will be when you change the significance level.

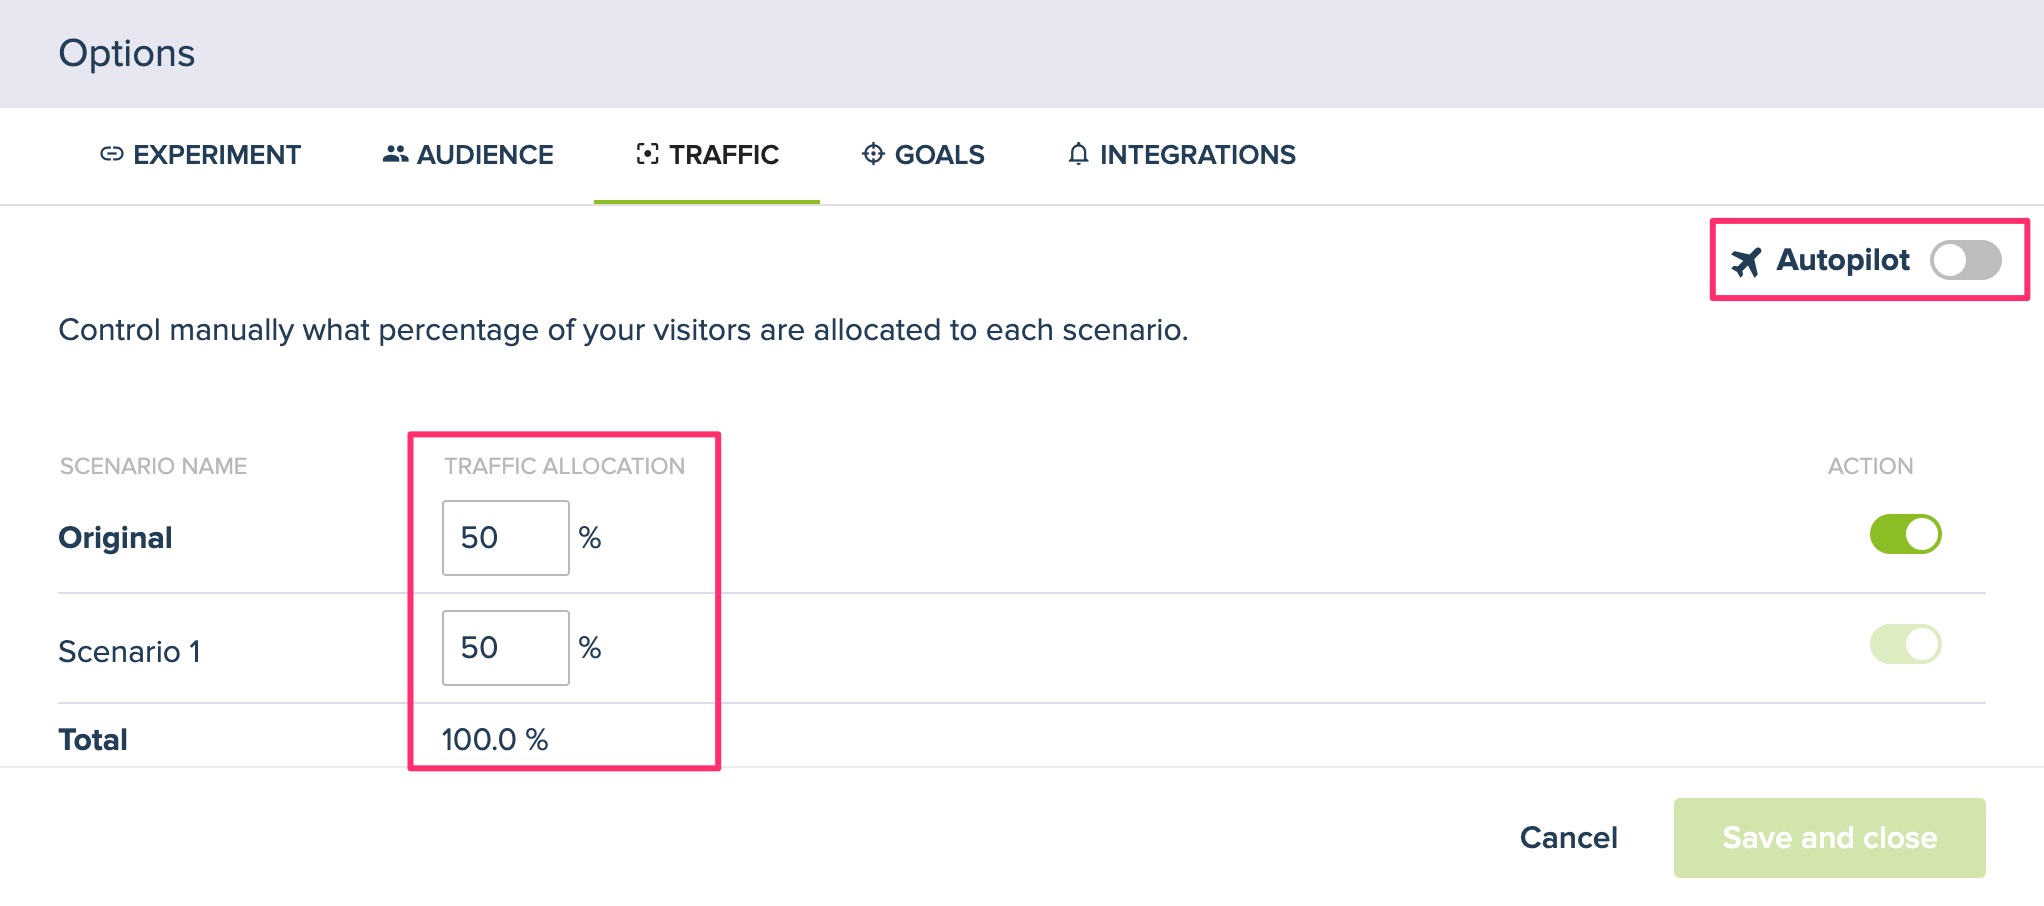
Autopilot and traffic allocation
Normally during A/B testing, you send a large proportion of potential customers to a less optimal variant. Autopilot Mode is a feature designed to maximise the value of the better performing variation of your A/B tests.
Autopilot Mode continually assesses the best performing variant in your test and allocates a higher percentage of traffic to it. This allows you to maximize conversions whilst running tests, without having to do anything. The Autopilot follows the performance of your primary goal.
By default, Autopilot mode is activated. We recommend leaving it that way. If, however, you wish to allocate the traffic manually, you can deactivate Autopilot mode in Edit experiment > Options > Traffic.
CR & Smart CR
Convertize allows you to view your results for CR (Conversion Rate) or Smart CR (Smart Conversion Rate). The difference between the two is that the Smart CR gives more weight to recent conversions, while the CR is the plain Conversion Rate.
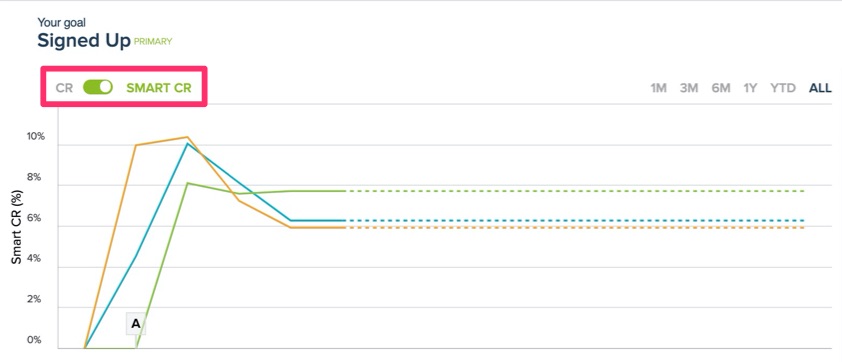
The Autopilot follows the Smart CR. This means that the Autopilot can respond more quickly to sudden changes in a page’s performance.
Editing and activity
In the Settings menu, at the top right of your results page, you can change the primary goal and the targeting of your experiment.
For any other changes, go to the editor by clicking ‘Edit Experiment’. Your experiment won’t be paused when editing.
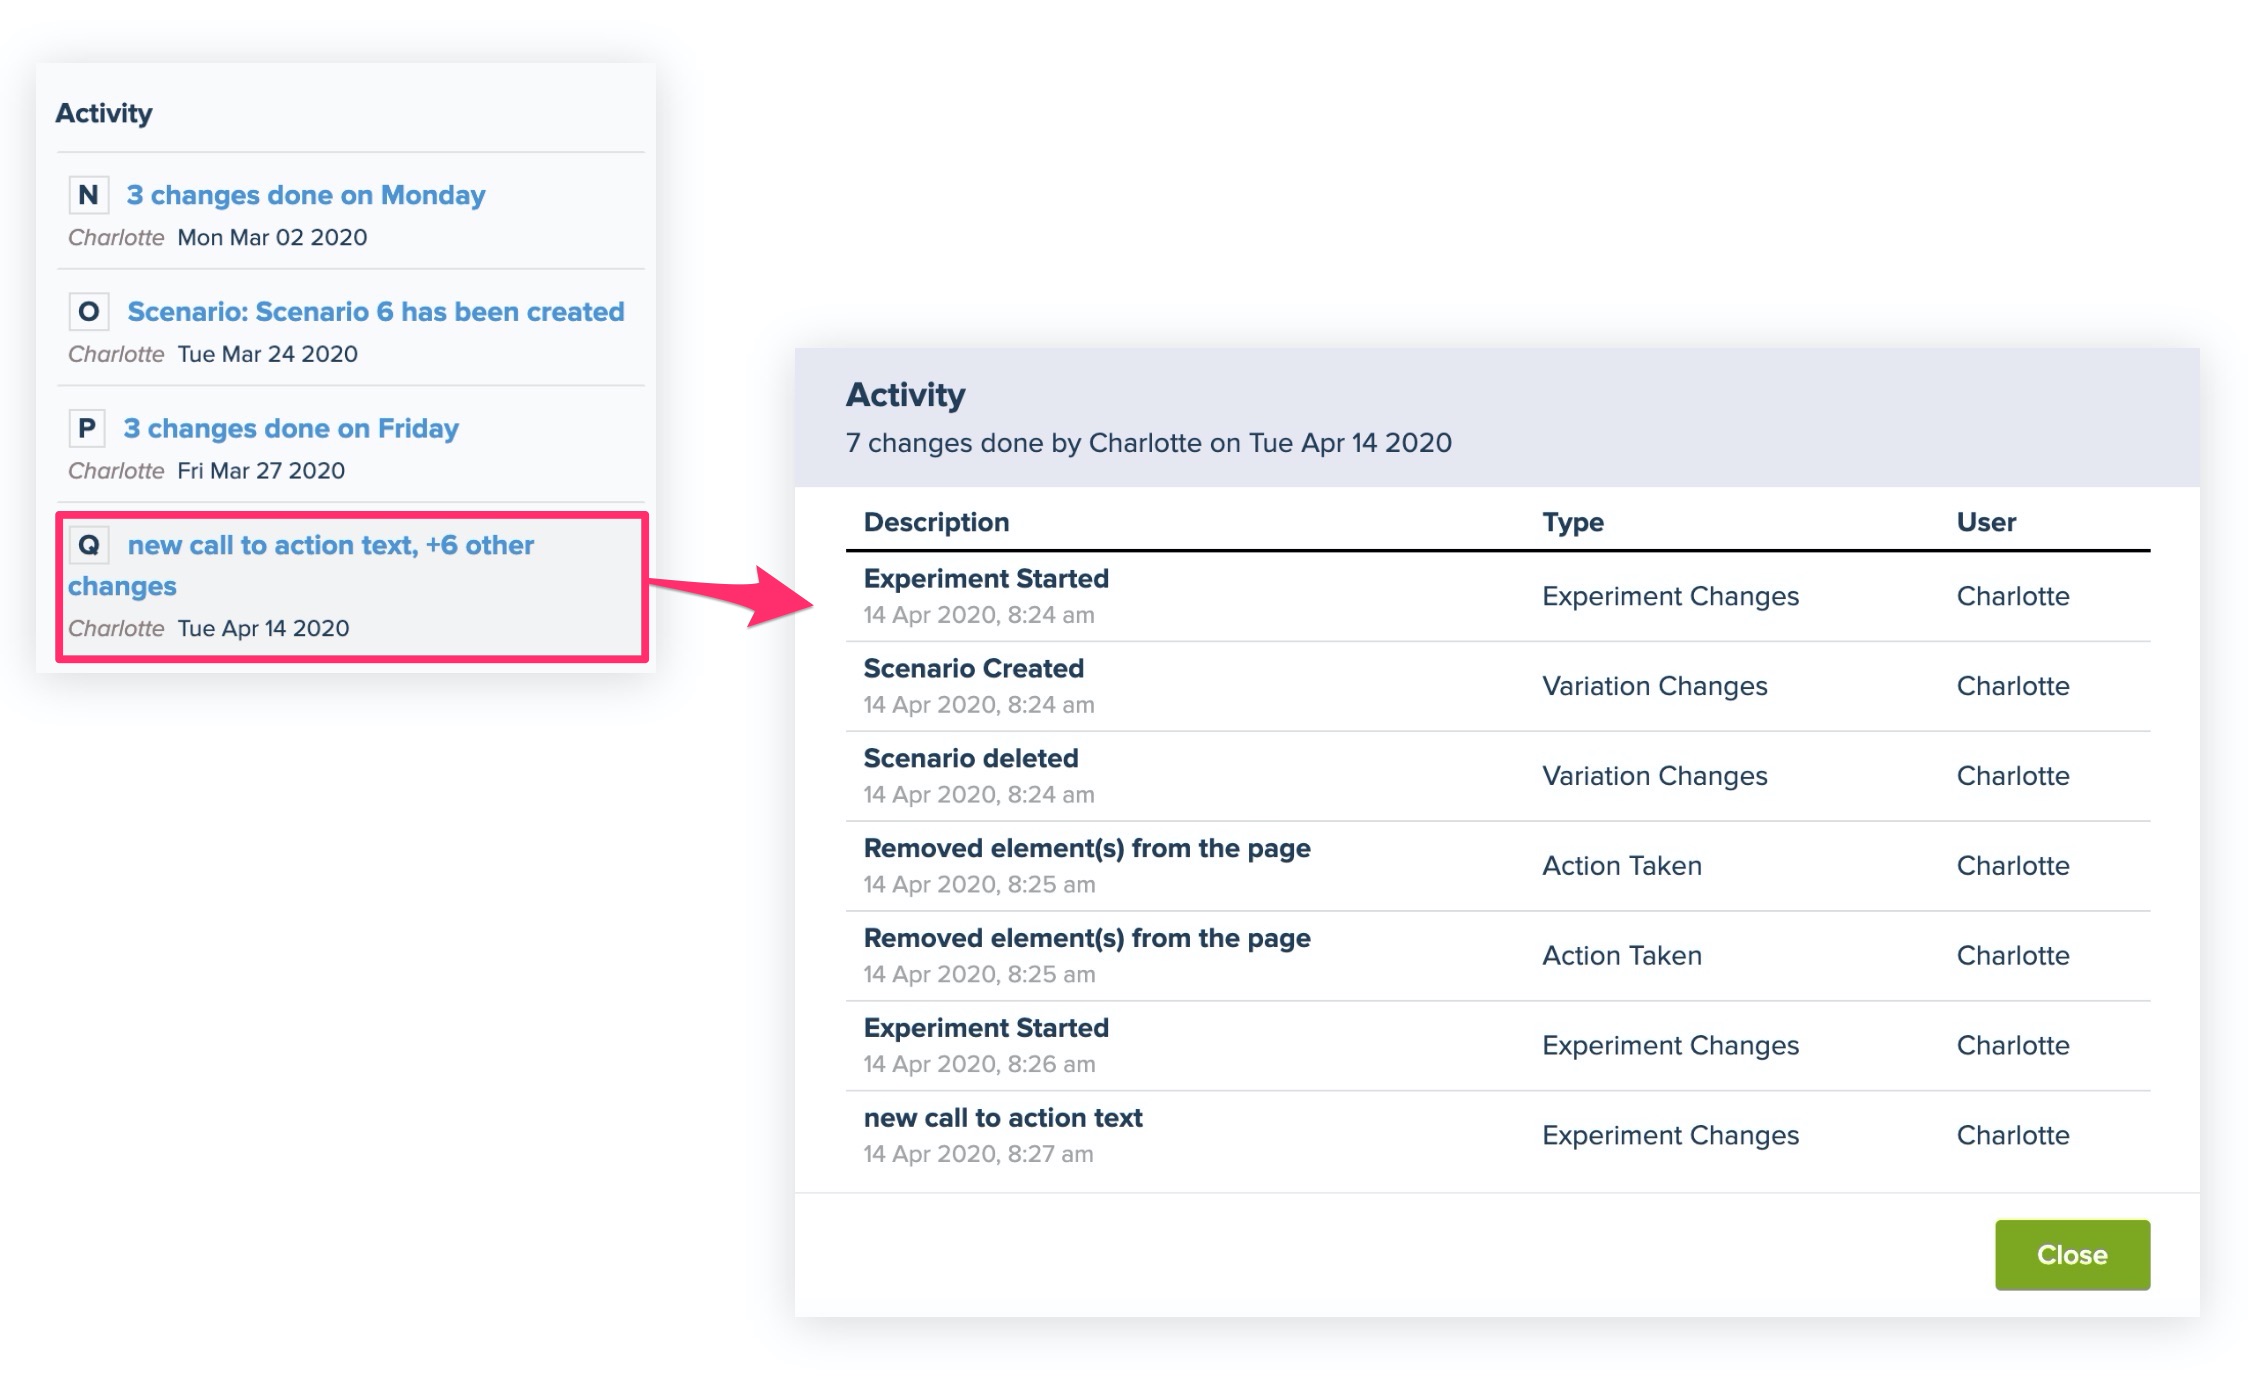
Any changes you make to your experiment while it is running, are logged in the ‘Activity’ field next to the chart. Here, you can see back:
- When you launched, paused and started your Experiment
- Any changes you made when editing your Experiment in the Editor
- Any settings that you changed, for example to the targeting
Each set of changes has a number that you can find back on the timeline in the chart. This way, you can see if sudden changes in your results correlate with a particular activity.
When you edit your experiment, you are prompted to give a brief summary of your changes so that you can easily interpret them on your results chart.
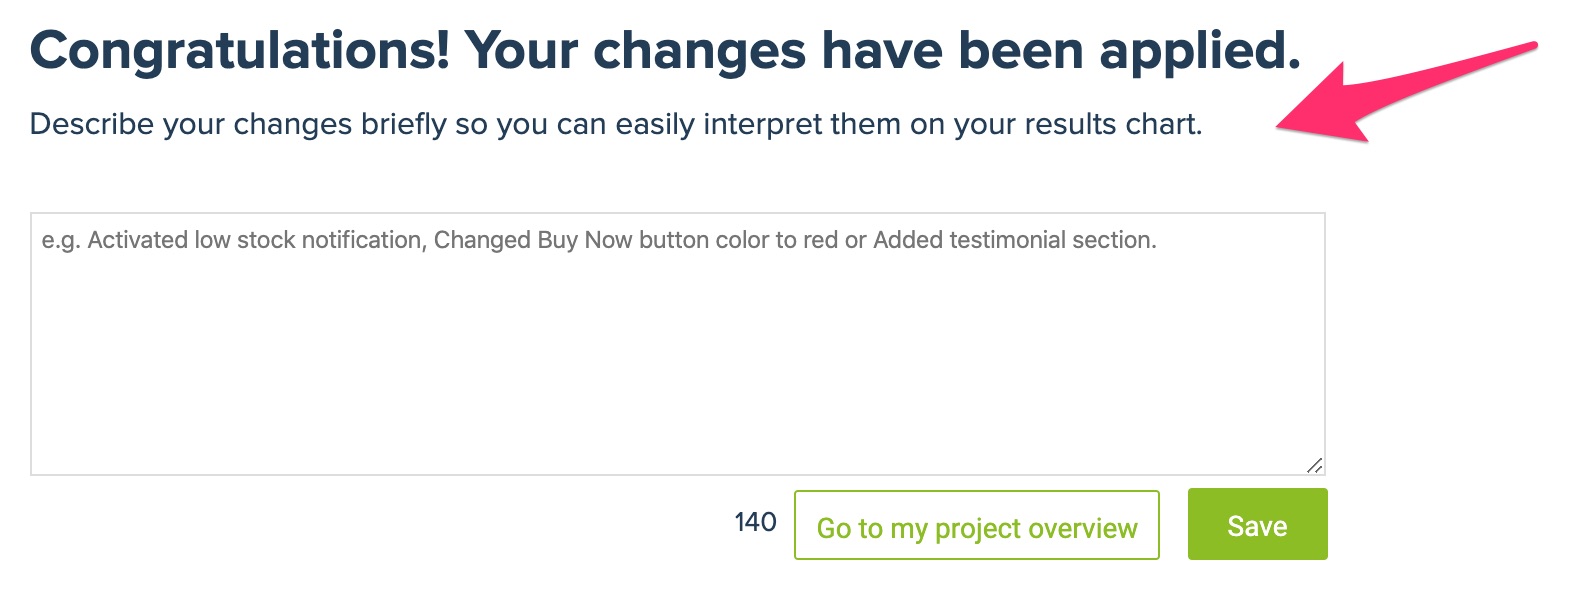
The activities are logged per day. When you made multiple changes on one day, you can see a breakdown by clicking on the change.