How To Know What To A/B Test
https://docs.convertize.io/fr/docs/quel-type-de-tactiques-de-persuasion-convertize-propose-t-il/Deciding what to A/B test is an important part of conversion rate optimization. Analyzing your website can be difficult, especially if you are new to analytics. It’s important to remember that each test can take several weeks to complete, so you need to prioritize them to get the maximum return. Convertize helps you at every step of the way and provides a library of A/B testing ideas to get you started.
How To Know What to A/B Test
- Step One: Analyze Your Conversion Funnel
- Step Two: Create a Hypothesis
- Step Three: Prioritize Your Tests
- Step Four: Keep Your Notes
A/B testing is the most powerful way to optimize your website, removing the things that lose you customers and adding important new elements. But how do you know which pages to focus on? And, once you know where the problem is, how do you know what to A/B test?
Step One: Analyze Your Conversion Funnel
To choose which pages to A/B test first, you need to analyze your conversion funnel. Every business website can be visualized as a funnel; leads enter at the top, but only a few people convert. Your job is to keep as many people in the funnel as possible.
The best way to do that is to watch how people behave on your website. There are 2 ways to analyze your funnel: 1) Funnel analysis software 2) Setting up a funnel in your analytics.
Funnel Analysis Software
Solutions like Mixpanel and Amplitude allow you to track leads through the entire customer journey. Using the conversion funnels provided by these platforms makes it easy to identify problem pages. Unfortunately, these are expensive solutions. Alternative funnel analysis software, such as Hotjar or Fullstory, provide less comprehensive lead management features but still make it easy to create funnels. There are also freemium solutions, such as Smartlook, which let you set up more limited conversion funnels.
You can use Convertize alongside any of these tools, applying the insights they give to help you choose what to test. However, most users prefer to set up a conversion funnel within their Google Analytics account.
Analyzing Your Webpages With Google Analytics
You don’t need to create a conversion funnel to start analyzing your website with Google Analytics. Some of the most useful data is available immediately, in the standard “Site Content” report. This report gives you the key behavioural data for each of your pages, including:
- Unique Pageviews (how many visits your page has received)
- Entrances (how many times your page was the first a user visited)
- Bounce Rate (the percentage of sessions that lasted less than 30 seconds)
- Site Exit (the percentage of views that were a user’s final page in a session)
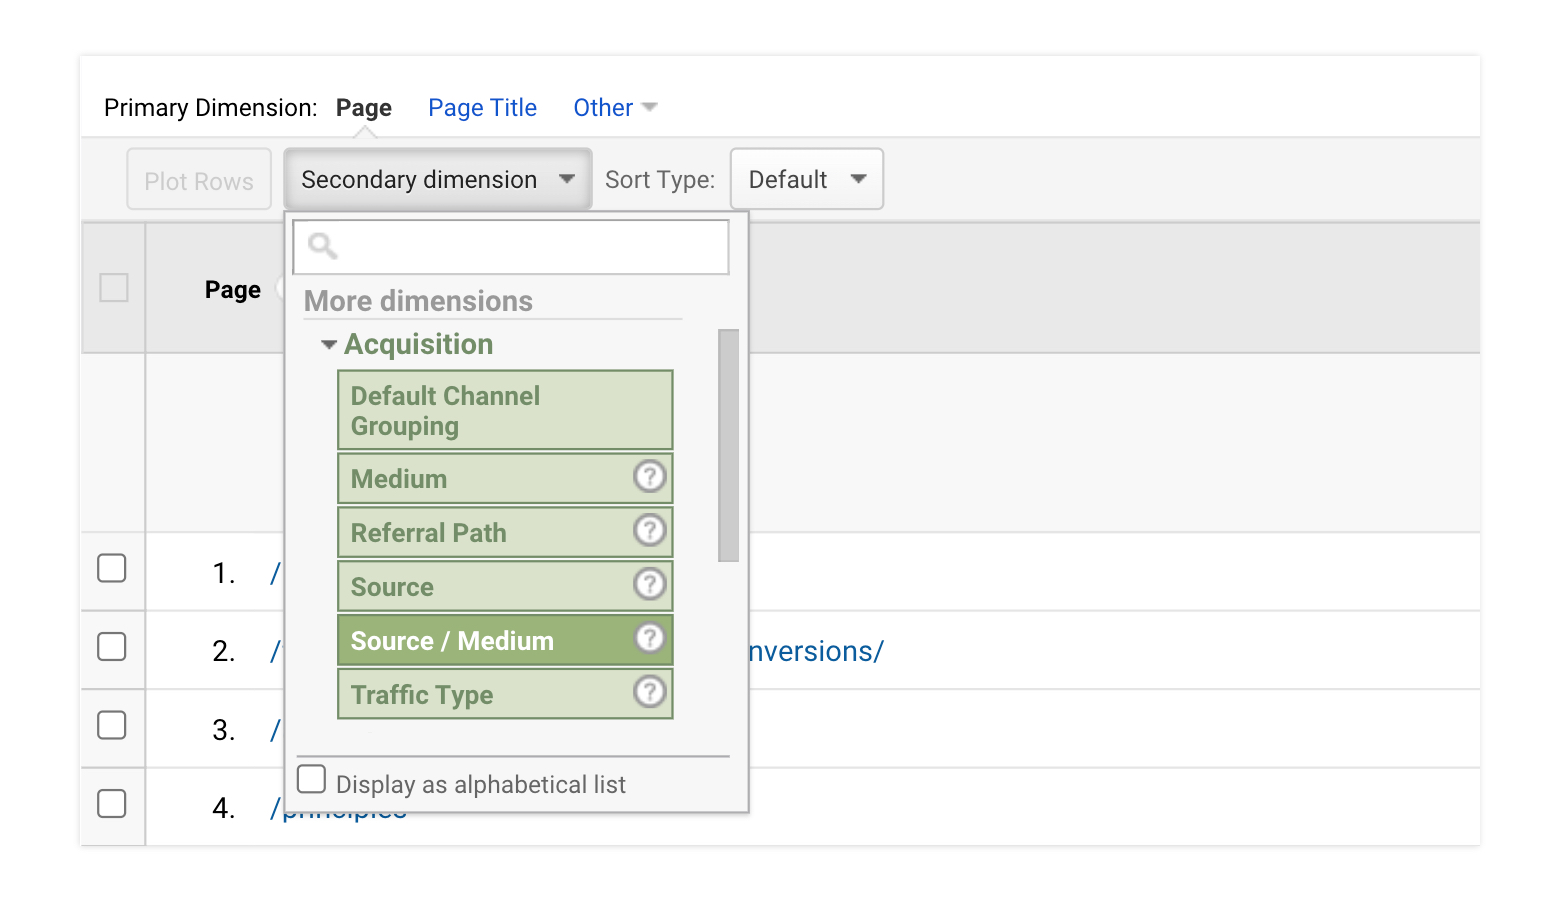
The most important things to look out for are unusually high numbers for Unique Pageviews and Site Exit. A page with high numbers for each of these metrics should be a priority. You can get a more detailed insight by adding a secondary dimension to your report. For example, adding a Source/Medium dimension will allow you to see how each type of traffic behaves on each of your main pages.

Once you have organized your data into a useful table, you can export it into an Excel or Google Sheets document.
Creating a Google Analytics Conversion Funnel
To create a conversion funnel report in Google Analytics, you need to specify some Goals for your view. You can do that in the Admin section of the platform.
There are two main ways to track goals: 1) with destination URLs, such as a “Thank You” page 2) by setting up an Event. To create a conversion funnel report, you need to make sure you use a destination goal.
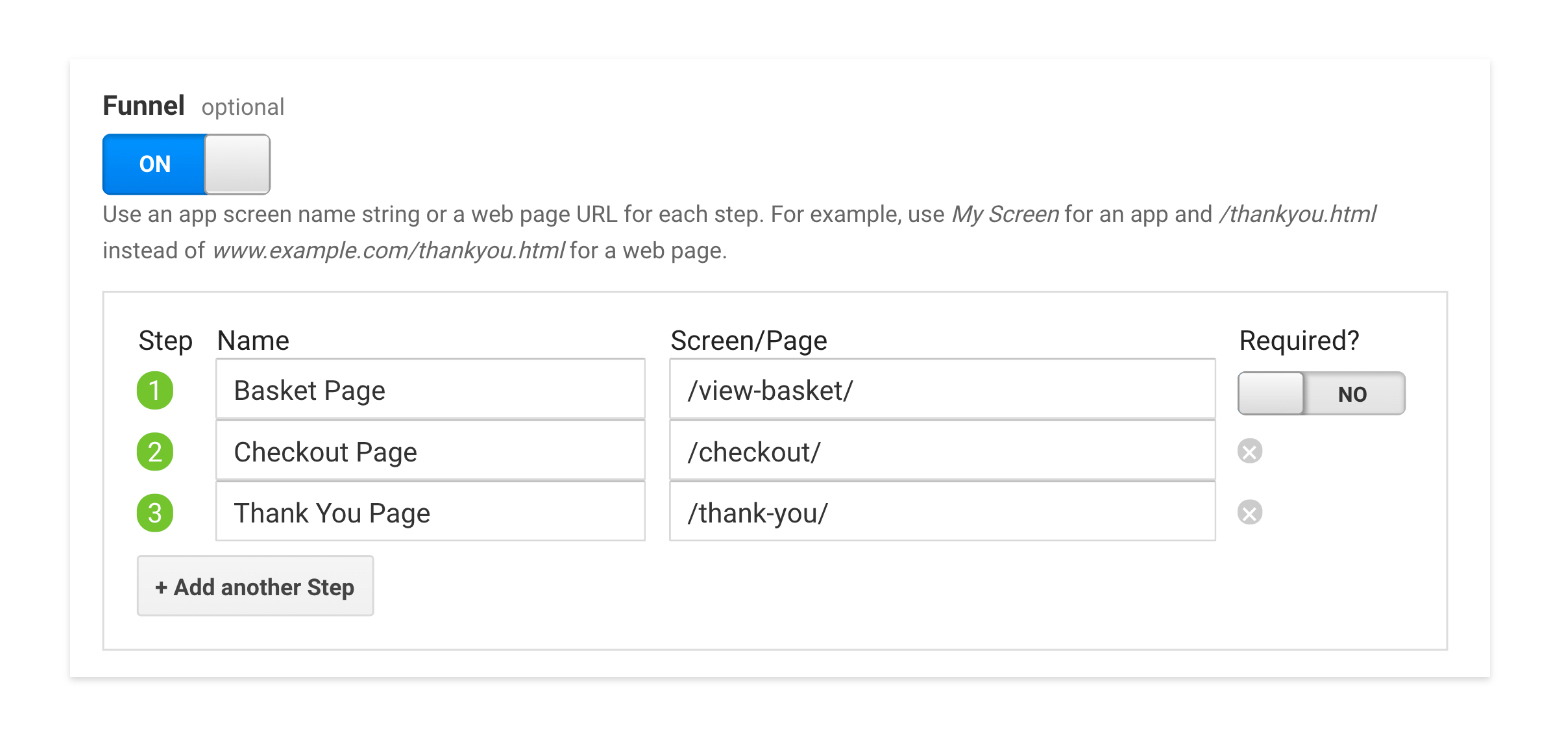
Once you have created your goal, you will automatically get the option to set up a custom Funnel, specifying the steps you expect a customer to take. A typical eCommerce funnel will look something like this:
- Product page
- Basket page
- Checkout
- “Thank You” page

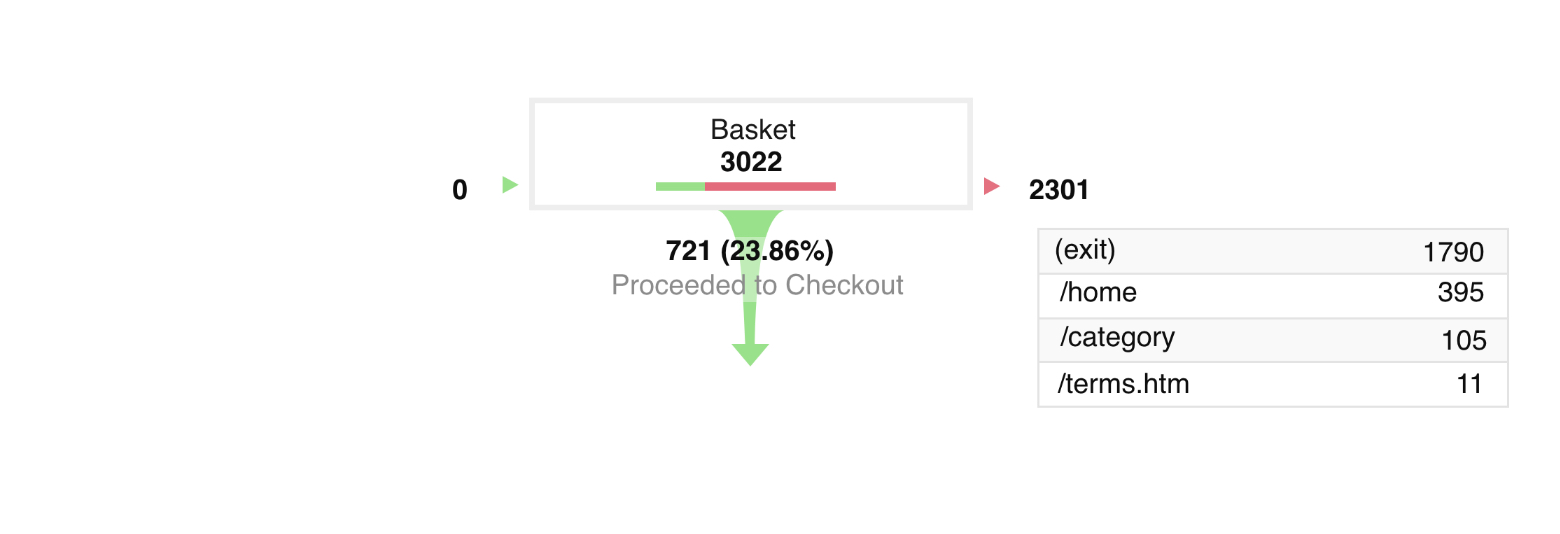
When you have created a custom funnel, the report is created automatically. You can find it by click on “Funnel Visualization” under Conversions. The report broken down into a series of steps, with users entering and leaving at each stage.

Once you have found the data for your webpages and your conversion funnel, it should be easy to see which pages are the highest priorities. The final part of your analysis is to see what kind of users are visiting the page and how they behave. You can add secondary dimensions to see how particular “affinity categories“, nationalities or device types are responding to your content. That will help you to create an A/B testing hypothesis.
Step Two: Create An A/B Testing Hypothesis
If you are using a CRO tool like Hotjar, you can use heat maps, scroll maps, user surveys and session recordings to see how people behave on your webpage. Unfortunately, these reports don’t tell you why people behave in that way. To create an effective hypothesis, you should think about things like User Experience and Consumer Psychology. CRO experts often return to a number of basic principles that make web content more usable and efficient. For example, when deciding what to A/B test, you should consider the following:
- Value: A business website should be focused around communicating a Value Proposition.
- Attention: Our ability to make sense of what we see depends on how complex it is and how it is structured. See, Kahneman, Attention and Effort (1973) and also Bruya and Tang, Is Attention Really Effort?
- Cognitive Load: Users prefer clear, straight-forward content, and reject information that is overwhelming or ambiguous. See, John Sweller, Cognitive Load Theory and Instructional Design, 1994.
- Implicit Egotism: Most people interpret the world according to a singular perspective. See, Brett Pelham, Implicit Egotism, 2005.
- Social Cognition: People make sense of most situations by placing them in a social context. See, Chris Frith, Social Cognition, 2008.
- Choice Architecture: If you want people to do something, you should make it easier for them. See, Richard Thaler, Nudge, 2008.
- Framing: We decide what things mean based on how they are presented to us. See, Erving Goffman, Frame Analysis, 1974.
Sometimes, it is easy to see how a webpage can be optimized and your hypothesis is obvious. Other times, CRO experts have to struggle with mountains of data and design theory to pinpoint crucial elements. However, the best strategy is often to base your A/B tests on ideas and principles that have been shown to work before. That’s where a Library of A/B testing ideas comes in useful.
The Convertize A/B Testing Library
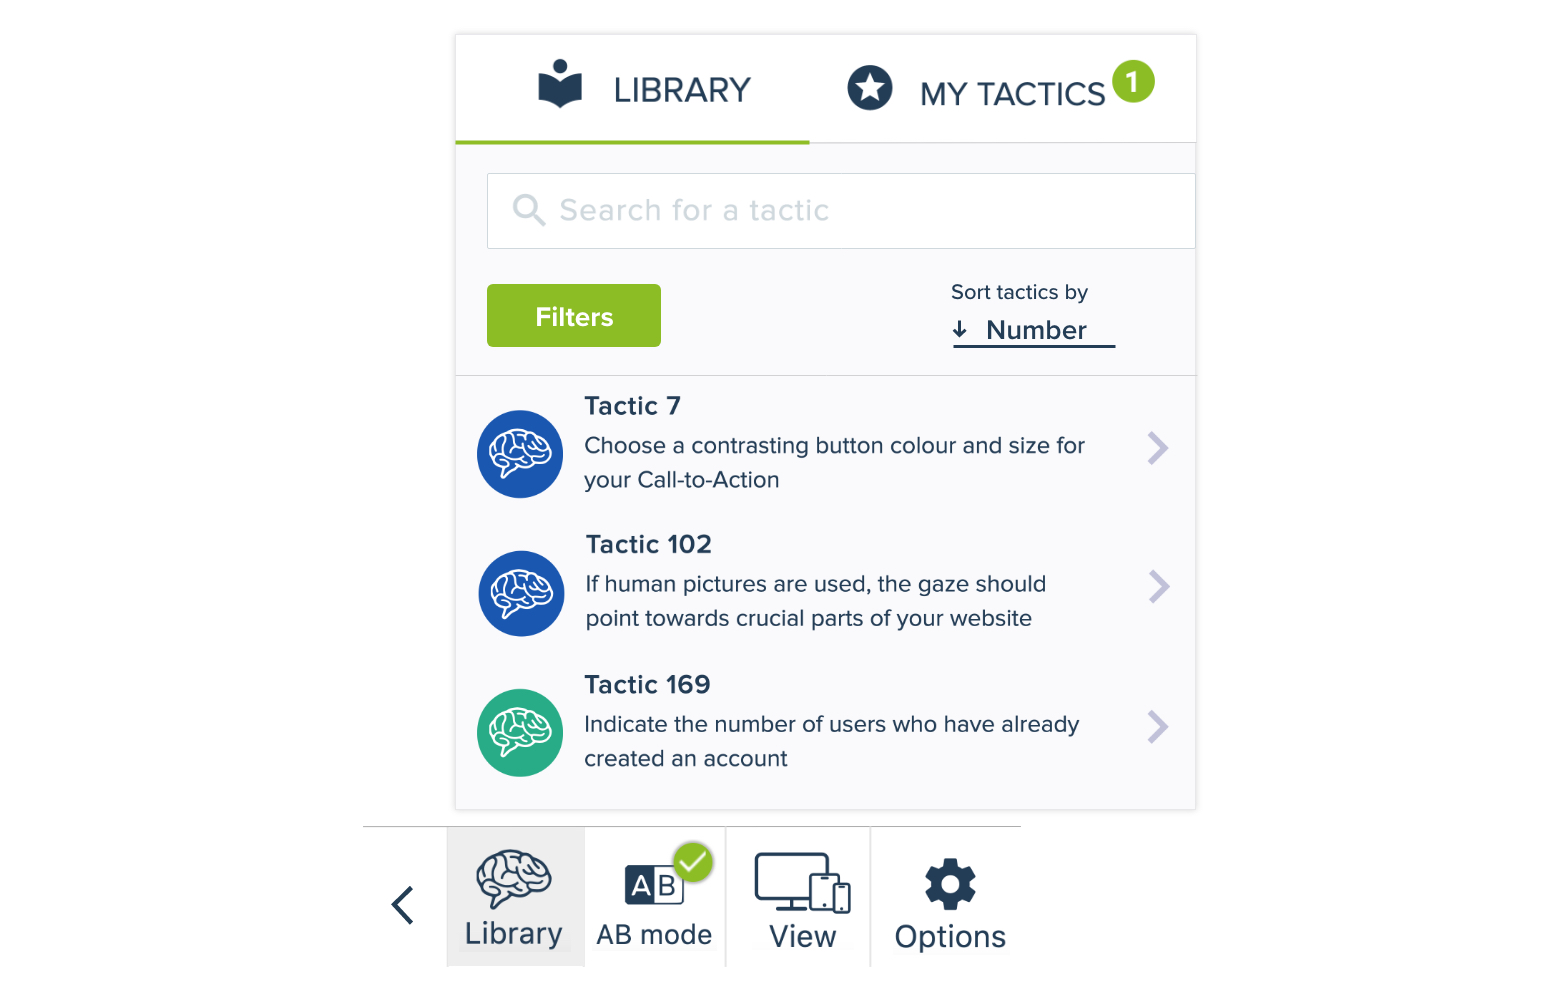
Convertize provides a reference archive of the most powerful A/B testing ideas, based on user experience principles and psychology. These ideas take the form of over 250+ Optimization Tactics that explain how to create useful experiments.

The tactics can be filtered based on your goals and the pages you are optimizing, so you always have a ready-made hypothesis to test. To get the most out of the built-in library, you can bookmark the documentation article on how to filter and implement tactics.
Step Three: Prioritize Your Tests
Once you have created a list of A/B testing ideas, you need to prioritize them. You can do this by creating a simple table, listing each hypothesis and giving them a score. The most important factors to consider when choosing what to A/B test first, are:
- Whether the test will affect one of your main KPIs.
- Which pages your test will affect, and how important they are.
- How visible the element is (is it above the fold, for example).
- What kind of change does the test involve. Will it change what you offer or just the appearance of your page.
- Is there good evidence that the test will work?
 Unless you are doing a multivariate test (which will require hundreds of thousands of visitors each month) you should only test one element per page at a time. Otherwise, it will be harder to interpret your results when the test finishes.
Step Four: Keep Your Notes
One of the best sources of new A/B testing ideas is your own notebook. Keep a record of any A/B tests you perform, so that you can return to it when deciding what to A/B test for another project.